CoordOps Network Map: A Live View of Your Engagement
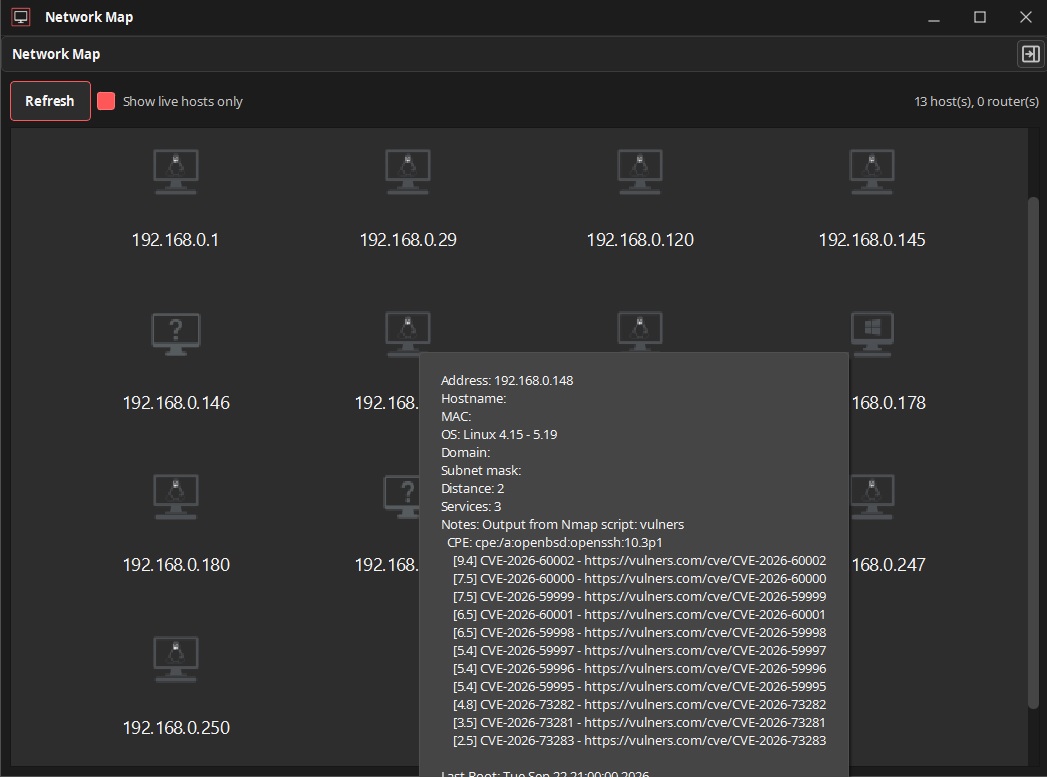
The CoordOps Network Map turns the hosts discovered during an engagement into an interactive topology. Routers are positioned around the map, while workstations, servers, and other devices are grouped with the appropriate router using their /24 subnet when possible. Hosts without a confident subnet match remain visible rather than being omitted. If no router has been identified, CoordOps automatically arranges the hosts in a clear grid.
The map is built directly into CoordOps Desktop using a native graphics scene rather than an external graphing service. Operators can zoom with the mouse wheel, pan by dragging the background or using the middle mouse button, and use the live-host filter to switch between currently reachable systems and the complete session inventory.
Dedicated icons distinguish routers, Active Directory servers, Windows systems, Linux and Unix systems, macOS devices, and hosts whose operating system has not yet been identified. Each node is labeled with its available IP address or hostname, while a summary shows the number of visible hosts and routers represented on the current map.
Each node carries the operational context already collected by CoordOps. Hovering over a host displays details such as its address, hostname, MAC address, operating system, domain, subnet mask, network distance, discovered service count, notes, and current availability. Right-click actions open a host-details popup or apply a red, green, or blue marker to help operators visually group systems, flag priorities, or distinguish areas of interest.
Color markers remain in place when the topology automatically rebuilds during the current Network Map session. Operators can also return a marked node to its default appearance when the visual classification is no longer needed.
The Network Map watches the active session for changes. Every few seconds, it compares the current host inventory with the displayed topology. When scans, imports, or operator updates add a host or change its address, operating system, services, notes, availability, or network classification, the map rebuilds automatically. A manual refresh remains available whenever an immediate update is needed.
After each rebuild, CoordOps automatically fits the complete graph into the available window while preserving normal zoom and pan controls. This keeps larger topologies usable without requiring operators to manually recenter the map whenever the engagement inventory changes.
The Network Map does not perform network discovery by itself. It visualizes the engagement data already collected through CoordOps scans, parsers, imports, and operator updates. That separation means the topology reflects the same session record used by the host list, service inventory, notes, findings, and reporting workflows.
This gives red teams a practical visual layer over the engagement record: not a separate diagram that must be maintained by hand, but a map driven by the same host data used throughout CoordOps. It can help operators recognize subnet groupings, locate important infrastructure, identify isolated systems, and explain the current engagement scope to other team members without rebuilding the network picture in a separate application.